Information by Segment
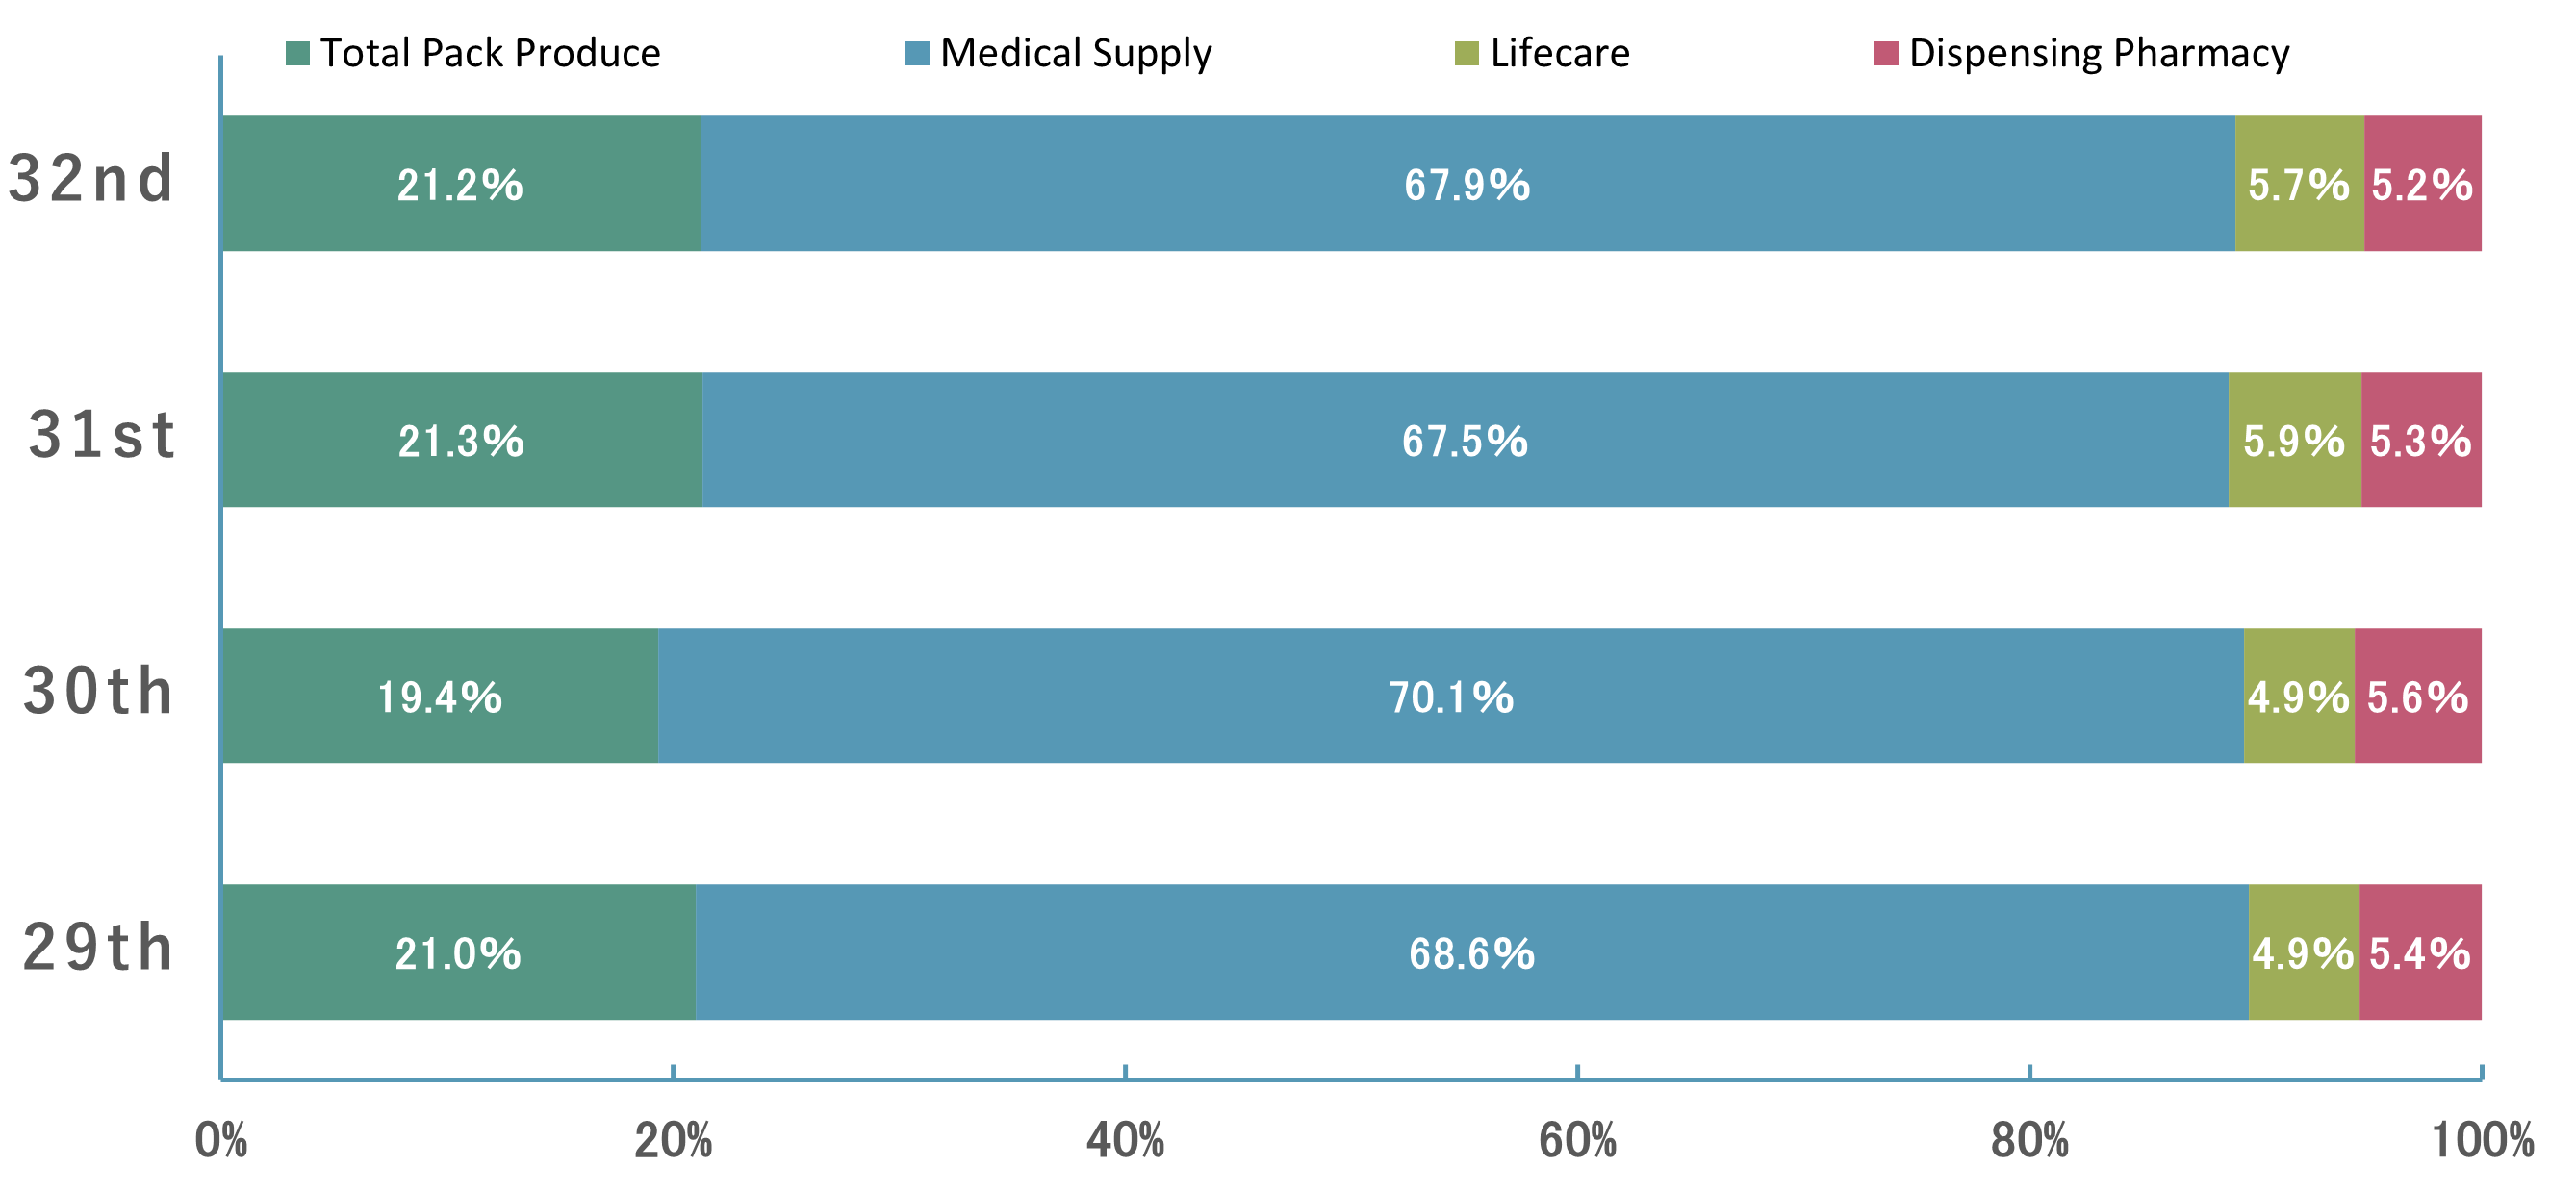
Net sales for each business segment

| Total Pack Produce | Medical Supply | Lifecare | Dispensing Pharmacy | ||
|---|---|---|---|---|---|
| FY 03/2024 32nd |
Net sales (million yen) |
133,717 | 428,451 | 36,099 | 32,719 |
| Raito(%) | 21.2 | 67.9 | 5.7 | 5.2 | |
| FY 03/2023 31st |
Net sales (million yen) |
121,868 | 386,335 | 33,581 | 30,499 |
| Raito(%) | 21.3 | 67.5 | 5.9 | 5.3 | |
| FY 03/2022 30th |
Net sales (million yen) |
99,539 | 360,635 | 25,247 | 28,930 |
| Raito(%) | 19.4 | 70.1 | 4.9 | 5.6 | |
| FY 03/2021 29th |
Net sales (million yen) |
104,355 | 341,157 | 24,571 | 27,070 |
| Raito(%) | 21.0 | 68.6 | 4.9 | 5.4 | |
From FY03/2022, due to the change in management accounting categories, the Company
has changed the classification of reportable segments, such as including business that were
previously included in "Other" into "Total Pack Produce Business". The segment information for
FY03/2021 consolidated fiscal year is created according to the changed classification.
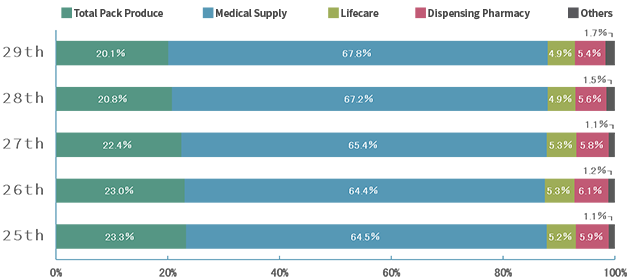
[Reference] Figures before the reclassification of reportable segments are as follows.

| Total Pack Produce | Medical Supply | Lifecare | Dispensing Pharmacy | Others | ||
|---|---|---|---|---|---|---|
| FY 03/2021 29th |
Net sales (million yen) |
99,959 | 337,244 | 24,571 | 27,070 | 8,309 |
| Raito(%) | 20.1 | 67.8 | 4.9 | 5.4 | 1.7 | |
| FY 03/2020 28th |
Net sales (million yen) |
100,688 | 325,664 | 23,929 | 27,050 | 7,062 |
| Raito(%) | 20.8 | 67.2 | 4.9 | 5.6 | 1.5 | |
| FY 03/2019 27th |
Net sales (million yen) |
99,441 | 290,363 | 23,500 | 25,585 | 5,157 |
| Raito(%) | 22.4 | 65.4 | 5.3 | 5.8 | 1.1 | |
| FY 03/2018 26th |
Net sales (million yen) |
98,064 | 274,058 | 22,724 | 25,789 | 4,929 |
| Raito(%) | 23.0 | 64.4 | 5.3 | 6.1 | 1.2 | |
| FY 03/2017 25th |
Net sales (million yen) |
95,245 | 263,528 | 21,167 | 24,134 | 4,412 |
| Raito(%) | 23.3 | 64.5 | 5.2 | 5.9 | 1.1 | |
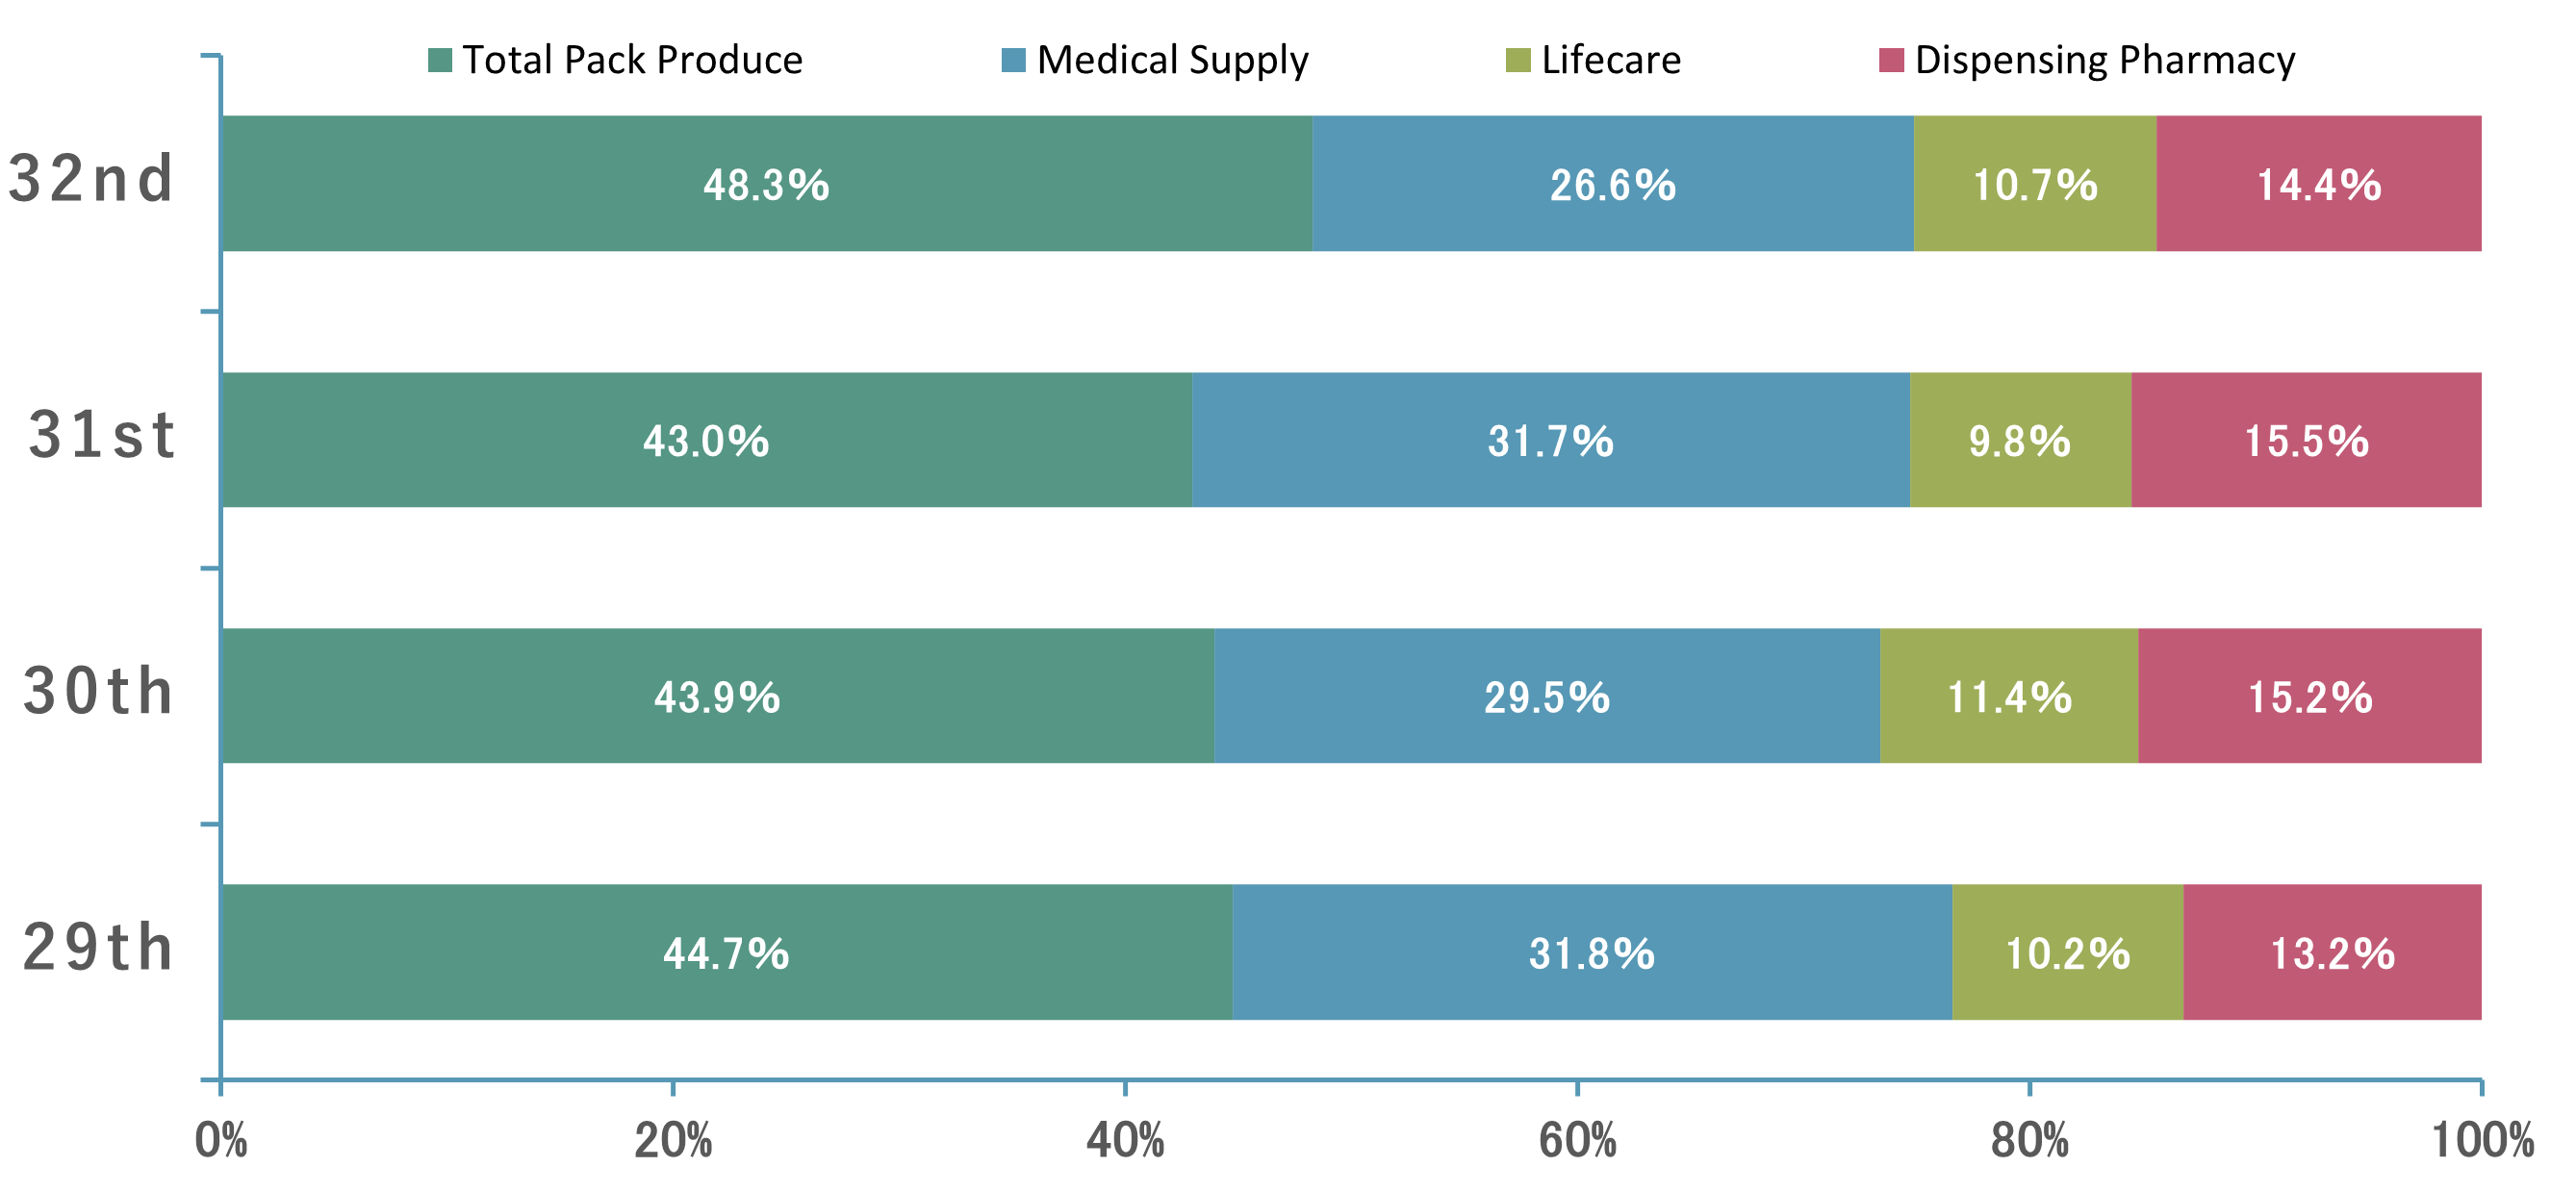
Segment profits(Operating income)

| Total Pack Produce | Medical Supply | Lifecare | Dispensing Pharmacy | ||
|---|---|---|---|---|---|
| FY 03/2024 32nd |
Segment profits (million yen) |
11,805 | 6,513 | 2,606 | 3,530 |
| Raito(%) | 48.3 | 26.6 | 10.7 | 14.4 | |
| FY 03/2023 31st |
Segment profits (million yen) |
9,024 | 6,666 | 2,055 | 3,256 |
| Raito(%) | 42.97 | 31.74 | 9.79 | 15.50 | |
| FY 03/2022 30th |
Segment profits (million yen) |
9,265 | 6,209 | 2,407 | 3,200 |
| Raito(%) | 43.9 | 29.5 | 11.4 | 15.2 | |
| FY 03/2021 29th |
Segment profits (million yen) |
9,781 | 6,958 | 2,237 | 2,884 |
| Raito(%) | 44.7 | 31.8 | 10.2 | 13.2 | |
From FY03/2022, due to the change in management accounting categories, the Company
has changed the classification of reportable segments, such as including business that were
previously included in "Other" into "Total Pack Produce Business". The segment information for
FY03/2021 consolidated fiscal year is created according to the changed classification.
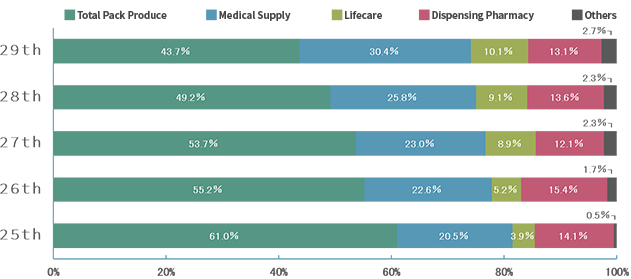
[Reference] Figures before the reclassification of reportable segments are as follows.

| Total Pack Produce | Medical Supply | Lifecare | Dispensing Pharmacy | Others | ||
|---|---|---|---|---|---|---|
| FY 03/2021 29th |
Segment profits (million yen) |
9,634 | 6,715 | 2,237 | 2,884 | 591 |
| Raito(%) | 43.7 | 30.4 | 10.1 | 13.1 | 2.7 | |
| FY 03/2020 28th |
Segment profits (million yen) |
9,620 | 5,035 | 1,770 | 2,661 | 449 |
| Raito(%) | 49.2 | 25.8 | 9.1 | 13.6 | 2.3 | |
| FY 03/2019 27th |
Segment profits (million yen) |
9,794 | 4,191 | 1,625 | 2,193 | 421 |
| Raito(%) | 53.7 | 23.0 | 8.9 | 12.1 | 2.3 | |
| FY 03/2018 26th |
Segment profits (million yen) |
10,150 | 4,161 | 955 | 2,826 | 303 |
| Raito(%) | 55.2 | 22.6 | 5.2 | 15.4 | 1.6 | |
| FY 03/2017 25th |
Segment profits (million yen) |
9,889 | 3,318 | 634 | 2,284 | 77 |
| Raito(%) | 61.0 | 20.5 | 3.9 | 14.1 | 0.5 | |
